
Greek tourism: taking stock

The past four years were a true roller-coaster ride for the tourism sector worldwide and Greece was no exception. Virtually overnight, the local tourism sector went from setting a fresh record in both arrivals and receipts in 2019 to requiring government support in 2020 in order to avoid wholesale bankruptcy. In this post we’re going to review the available data in order to try and pinpoint where the sector currently stands.
2022 was primed to be Greek tourism sector’s bounce back year. There was significant pent-up demand for travel services and people were still sitting on sizeable piles of forced savings amassed during the apogee of the Pandemic. But the emergence of the highest inflation rate in decades took the shine off 2022’s tourism figures and that potential bumper year failed to materialize.
But what failed to materialize last year, a fresh record in receipts and arrivals, may end up happening this year. The year’s not over yet and tourism data (like most figures) are released with a lag so the jury is still out on that one.
As far as Tourism Receipts are concerned and when expressed in 12-month rolling-sum terms, as of July, those have already powered up ahead of February 2020’s high.

It would be interesting though to see what those figures would look like when rid of inflation’s distortionary impact. I guess that means that it’s time for me to walk back on that statement I made in my first post here, i.e. that I’m not a big fan of deflating time-series on a DIY basis. The Hotels & Restaurants component of HICP is going to be the deflator and the (EXi/Pi)*100 formula is going to be used, where EX = Travel Services Exports, P = HICP Restaurants & Hotels with i denoting the month that each time-series value refers to.
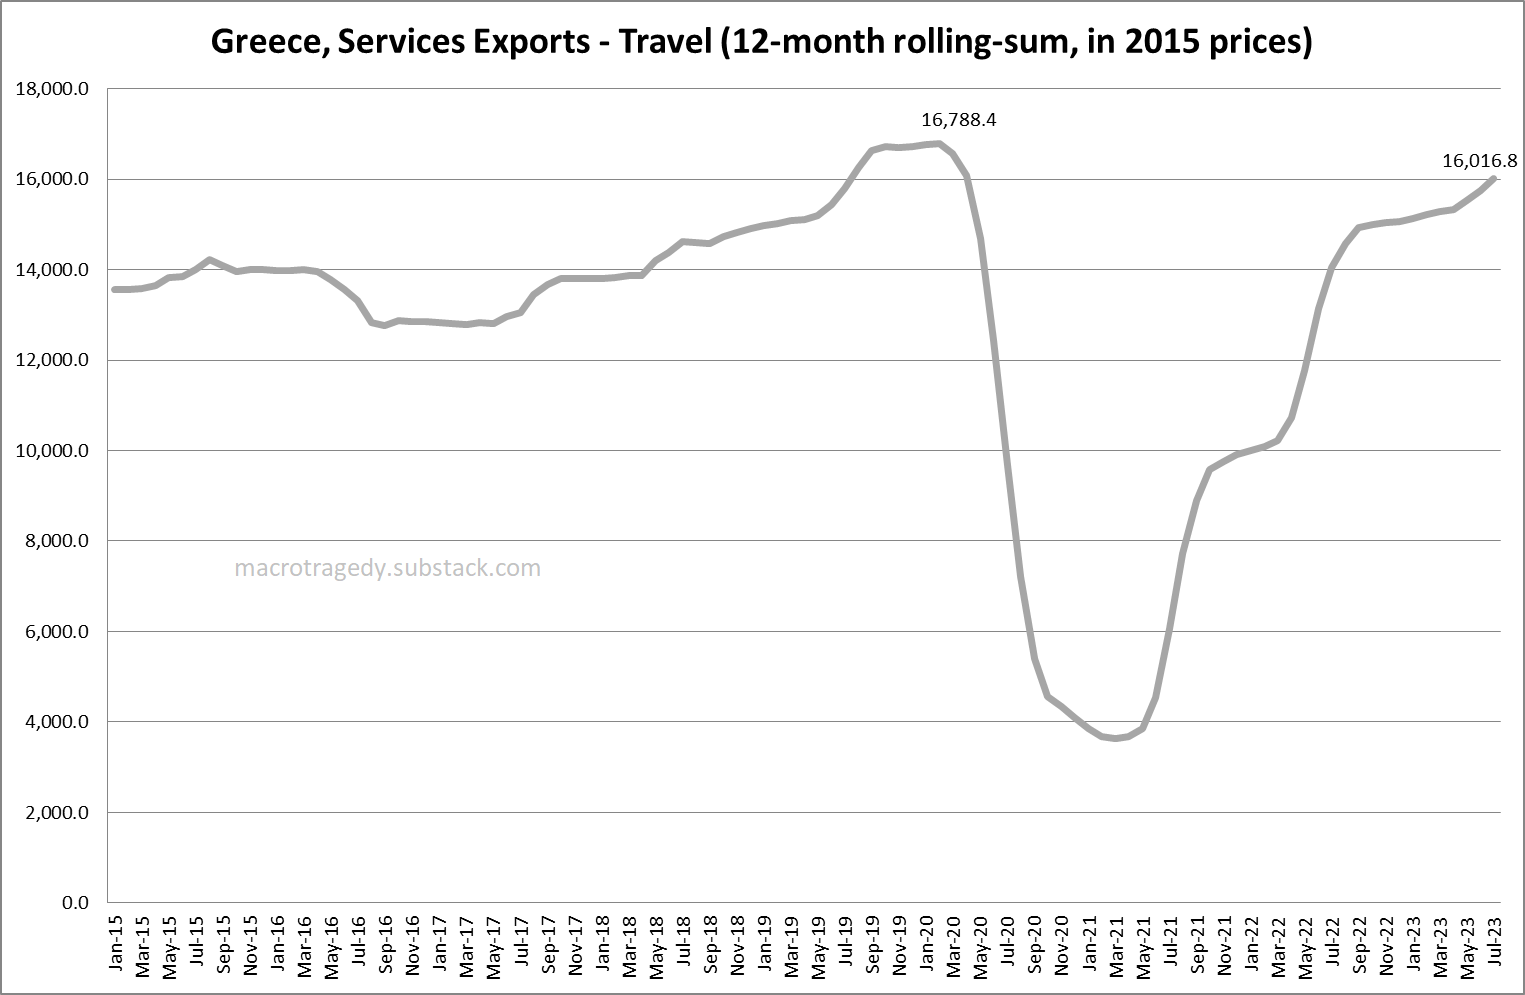
As it turns out, when expressed in 2015 prices, the 12-month rolling-sum of Tourism receipts has not breached February 2020’s high yet but the distance that still needs to be covered is not all that great.
Moving on to Arrivals, one can see that here too (in 12-month rolling-sum terms) February 2020’s high has not been surpassed yet.
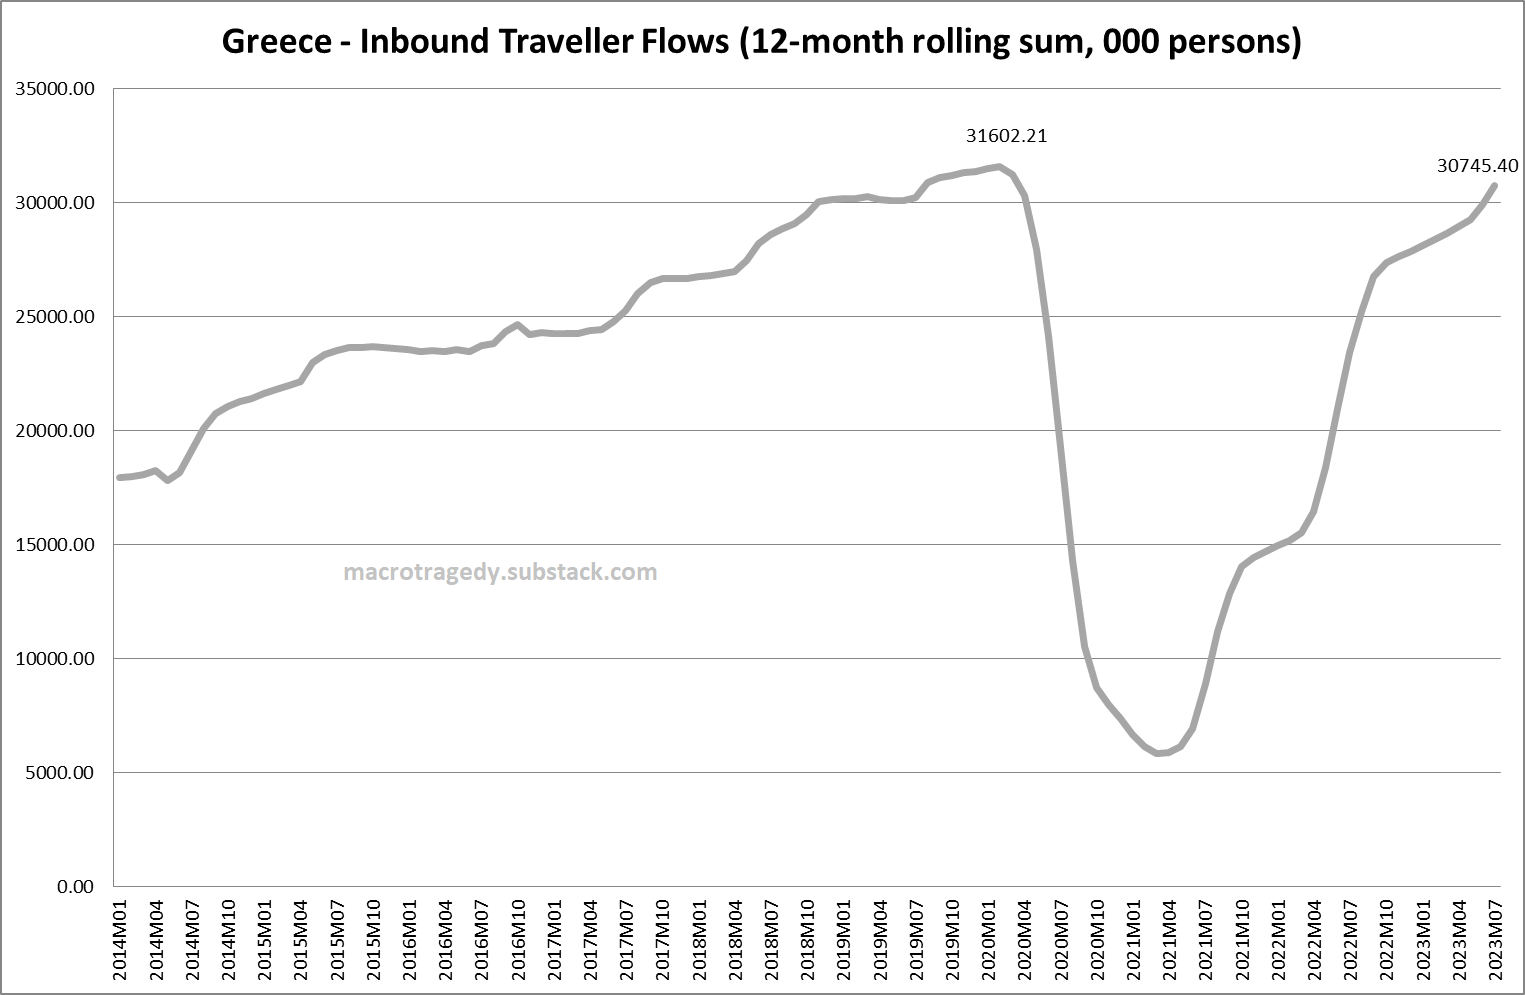
In order to try and pinpoint what’s holding arrivals back a look beneath the hood is warranted. Since arrivals broken down according to the visitors country of origin are not nearly detailed enough we’re going to have to make do with arrivals broken down by means of transportation.
First a little background. All data that have been utilized thus far are released from the Bank of Greece (BoG) but unfortunately BoG does not publish this particular datapoint that we’re after. We’ll have to rely on data provided by SETE (the relevant sectoral body when it comes to tourism). SETE does not collect its own primary data but it processes data collected by others, namely the relevant public and sectoral bodies and agencies. BoG’s data on the other hand are compiled through the use of sampling (the so-called Border Survey).
SETE publishes monthly data regarding Airport and Road Arrivals while data for Maritime Flows (Cruise and Ferry Arrivals from Italy) are released only in annual form. SETE’s data are not without their quirks as passengers of international flights are counted among international arrivals irrespective of their permanent place of residence as do foreign nationals when it comes to road arrivals. With that in mind let’s proceed.
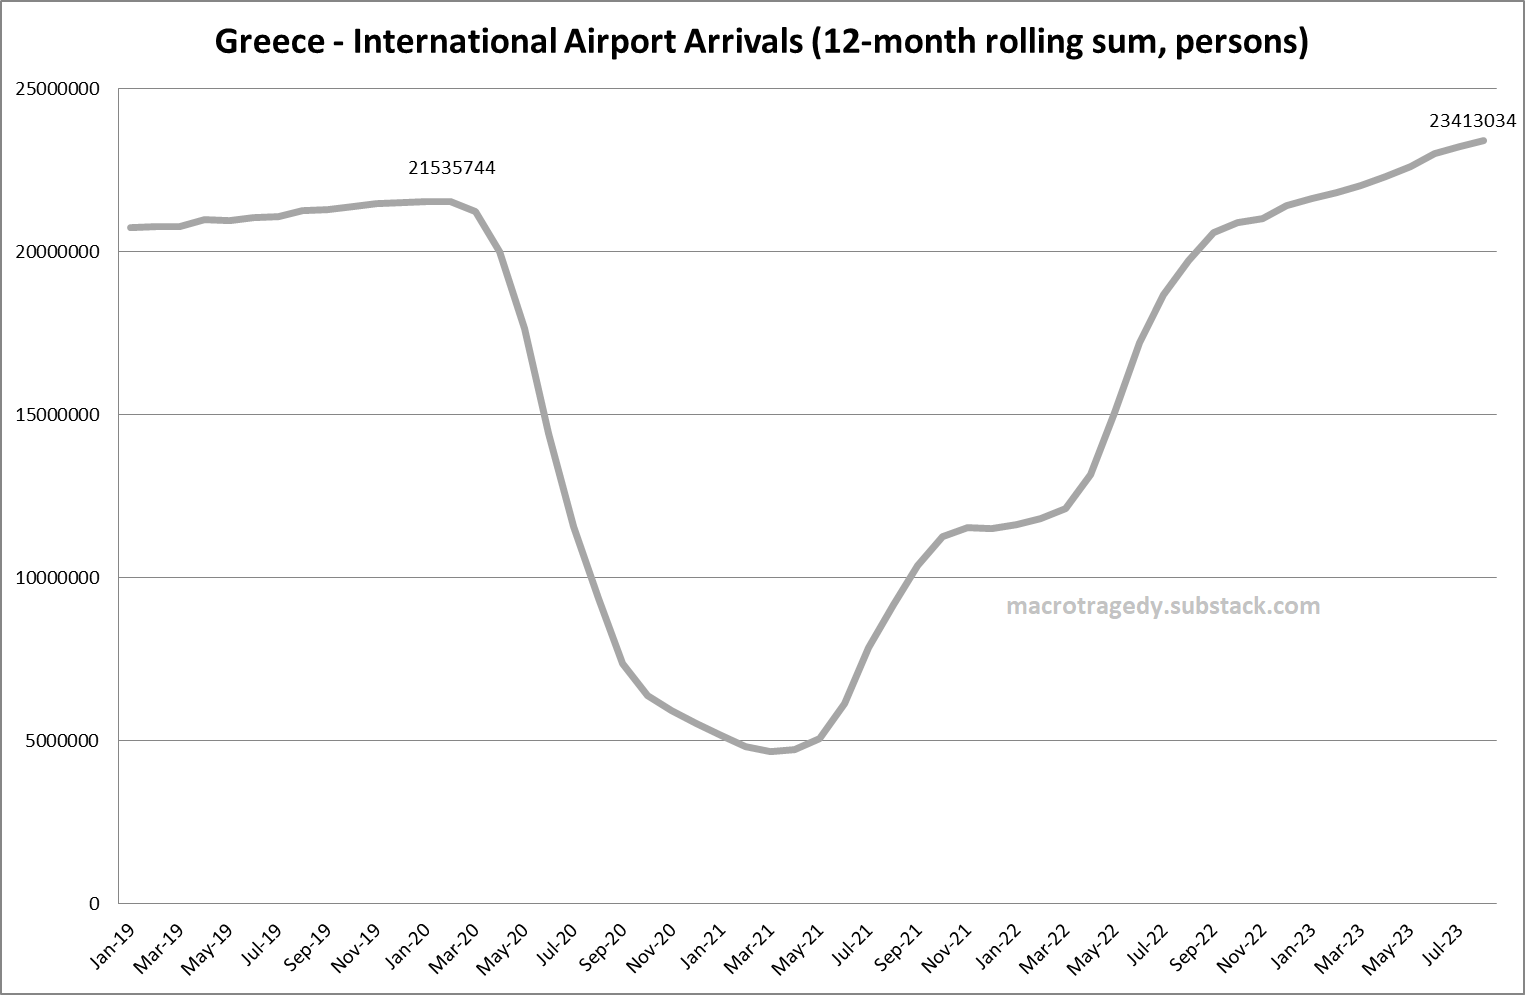
International Airport Arrivals, up until August, have cleared previous highs by a country mile and could end up making up for any potential shortfalls stemming from arrivals through other means of transportation.
Road Arrivals on the other hand, as of August, were still lagging behind previous highs.

The driver behind this could be the fact that the countries sharing a land-border (I’ve added Serbia to those with the rationale that since Greece receives a large number of visitors from Serbia so there must be some that choose to drive here) with Greece were hit pretty hard by the global inflationary wave with the majority of them (with the sole exception of Albania) registering inflation rates well higher than the EU average. Since consumers in those countries (who all belong in the upper middle income bracket if I’m not mistaken) saw their purchasing power take such a hit it would make sense if some of them wouldn’t be able and/or willing to splash the amount necessary for a vacation in Greece.
I didn’t include Turkey in the chart above since its vastly higher inflation rate would make the lines for the rest of the countries appear much more convoluted.
As mentioned above, data for visitors who arrive in Greece through the sea route are not available on a monthly basis but in their annual form they show that 2022 figures for both forms of maritime arrivals were lower than their 2019 levels.

Since we’re already at it, we might as well take a look at what annual data for all means of transportation show.

As we can see diminished road arrivals were the single largest catalyst for the shortfall of arrivals in 2022.
Finally, we should take a look at how different destinations are faring on a Year-to-Date (YTD) basis in 2023. Since, at least as far as I know, other data are not available, the only proxy one can use is International Airport Arrivals at main airports, which are again provided by SETE.

The only destinations that are down YTD are the more high-end ones and this of course speaks volumes about the current environment.
I think it’s time to wrap this up.
Thus far 2023 has seen nominal receipts for Greece’s tourism sector rise to new highs* while receipts in real terms and arrivals are not far behind. On the other hand, lingering high prices and the tightening of monetary policy worldwide have left their mark too with high-end destinations clearly underperforming. Hopefully the final tally for the year will be a positive one and will work towards softening the blow from slowing or outright contracting activity in other sectors.
*in 12-month rolling-sum terms